Newborn growth charts compare size with healthy peers, while percentiles show patterns, not grades or diagnoses.
Newborn growth charts and percentile interpretation can feel confusing during an already busy season of feeding, sleep, and recovery. These charts use careful measurements, age, sex, and sometimes corrected age to show how a baby is growing over time. This guide explains what percentiles mean, which charts health professionals use, how to read changes, and when a result may need closer review.

What Are Newborn Growth Charts?
Newborn growth charts are visual tools that track a baby’s physical growth. They commonly show:
• Weight for age
• Length for age
• Head circumference for age
• Weight for length
Each measurement is placed on a chart beside data from many healthy children. The chart then shows where the baby falls compared with others of the same age and sex.
A growth chart is not a test that a baby passes or fails. It is more like a growth map. One point tells you where the baby is today, while several points reveal the direction of travel.
Newborn growth charts and percentile interpretation should always focus on the whole pattern. A single measurement can be affected by feeding, timing, movement, clothing, scale differences, or a small measuring error.
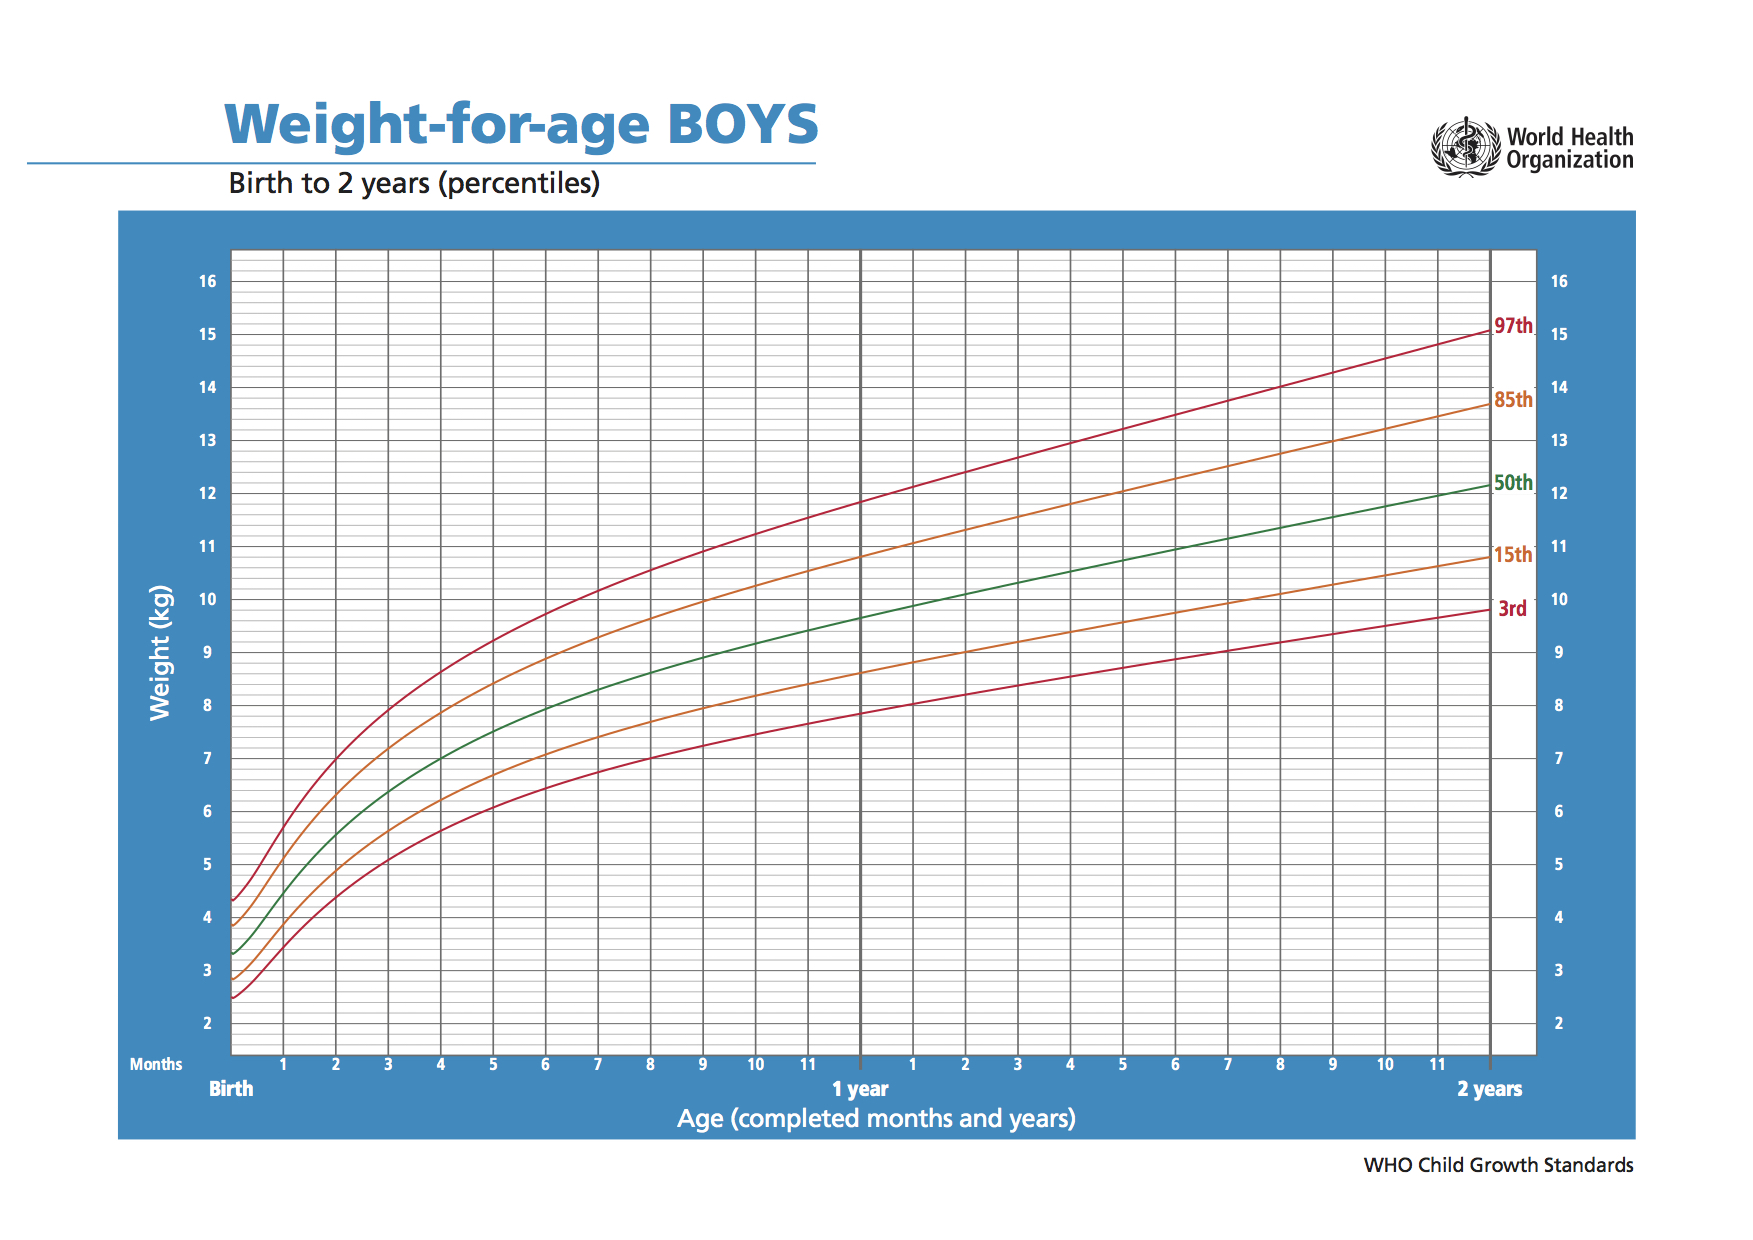
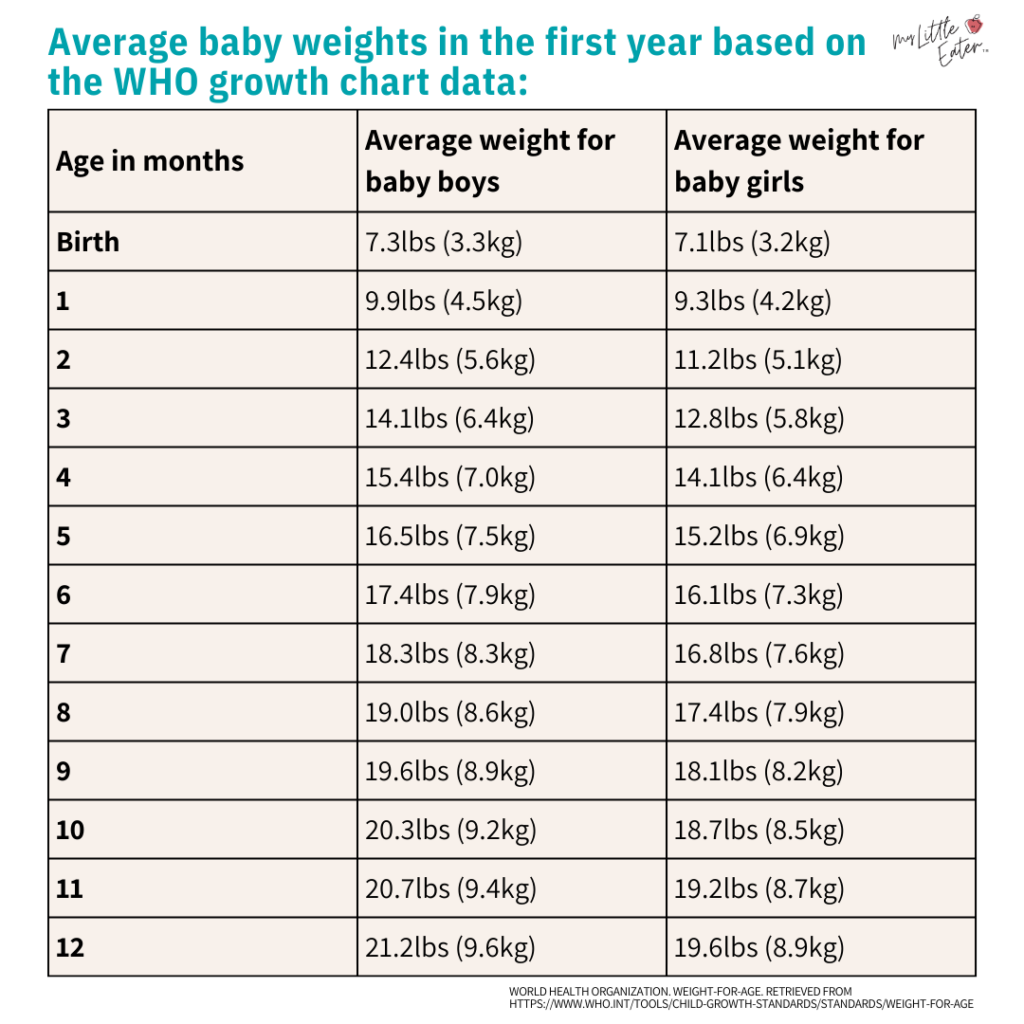
The World Health Organization growth standards describe how healthy breastfed infants may grow under favorable conditions. In the United States, health professionals often use WHO charts from birth to age 2 and CDC charts from age 2 onward. Your pediatrician may also consider special charts for premature infants or babies with certain medical needs.
What Do Percentiles Mean?
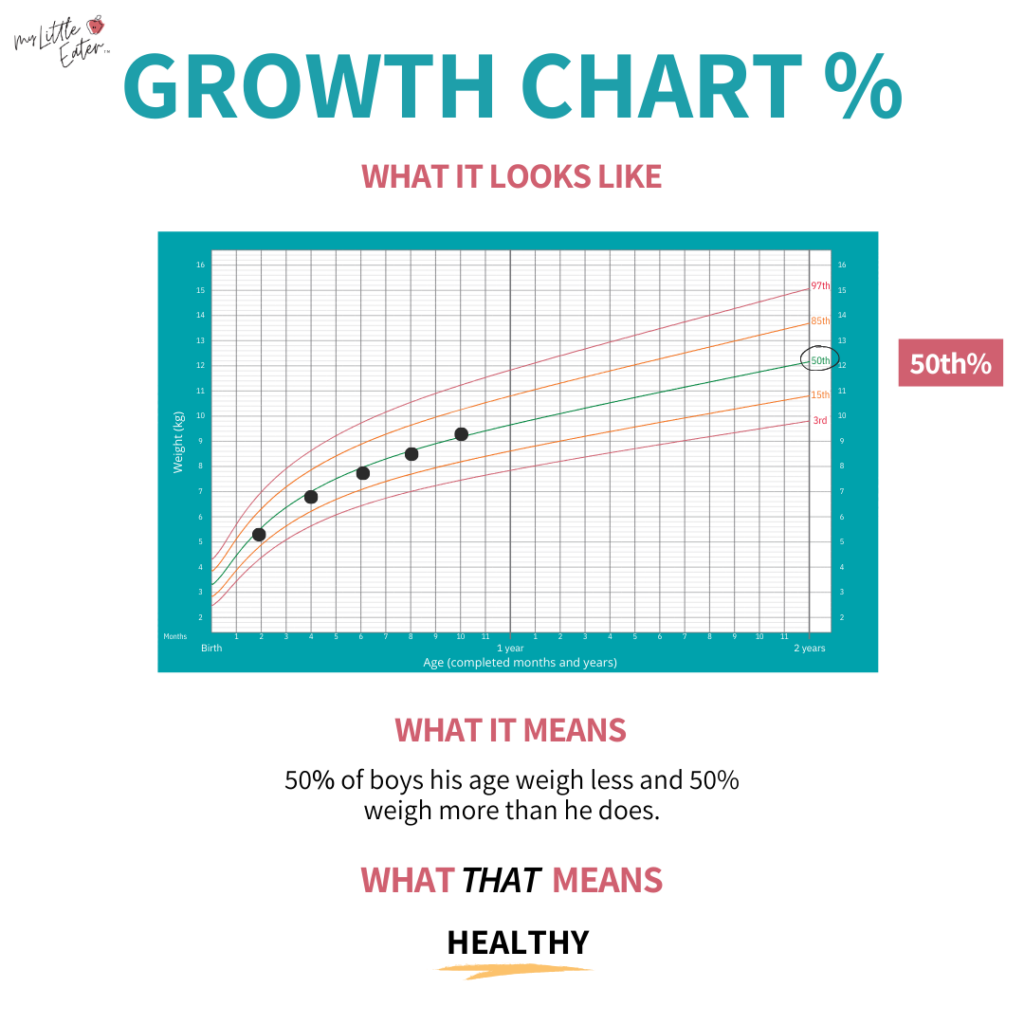
A percentile compares one baby’s measurement with measurements from a reference group. For example, if a baby’s weight is at the 40th percentile, about 40 percent of similar babies weigh less, and about 60 percent weigh more.
This does not mean the baby is healthier than babies at the 20th percentile. It also does not mean the baby should reach the 90th percentile. Percentiles describe position, not quality.
Newborn growth charts and percentile interpretation become more useful when parents understand these common ranges:
• A percentile near the middle can be completely normal.
• A low percentile can be normal if growth is steady and the baby is well.
• A high percentile can also be normal if body size fits the baby’s family pattern.
• A sudden change across several percentile lines may deserve attention.
• Weight, length, and head size should be viewed together.
A baby at the 10th percentile is not automatically underweight. A baby at the 90th percentile is not automatically overweight. Health professionals look at feeding, diaper output, activity, physical findings, birth history, and family size before drawing conclusions.
How to Read a Newborn Growth Chart
Reading a chart is easier when you follow the same steps each time.
1. Confirm the baby’s age
Use the baby’s exact age in weeks or months when possible. A difference of even a few weeks matters in early infancy because newborns grow quickly.
For premature babies, the clinician may use corrected age. Corrected age accounts for how early the baby was born. For example, a baby born eight weeks early at a chronological age of four months may be assessed closer to two months corrected age.
2. Check the chart type
Make sure the chart matches the baby’s:
• Sex
• Age range
• Gestational history
• Measurement type
A weight-for-age chart does not answer the same question as a weight-for-length chart. Confusing these charts can lead to unnecessary worry.
3. Find the measurement
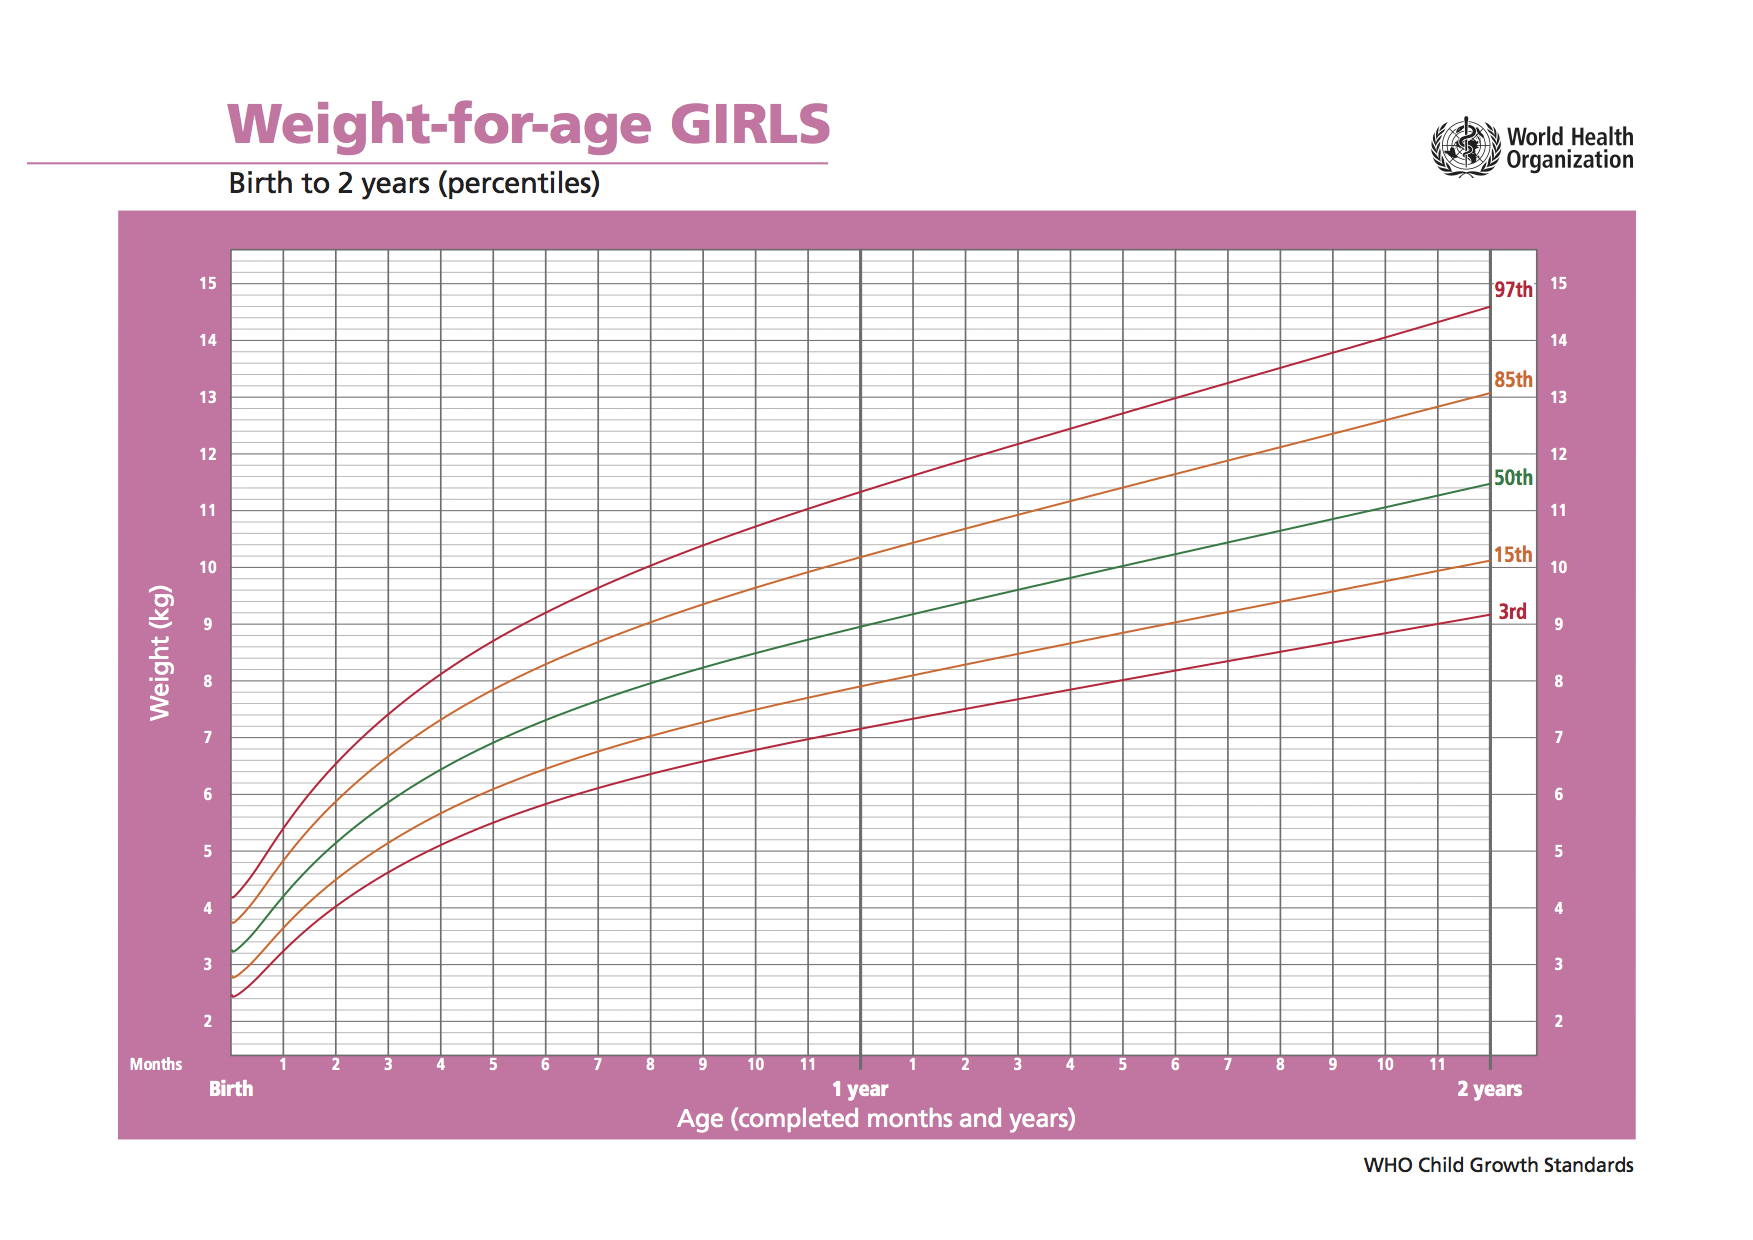
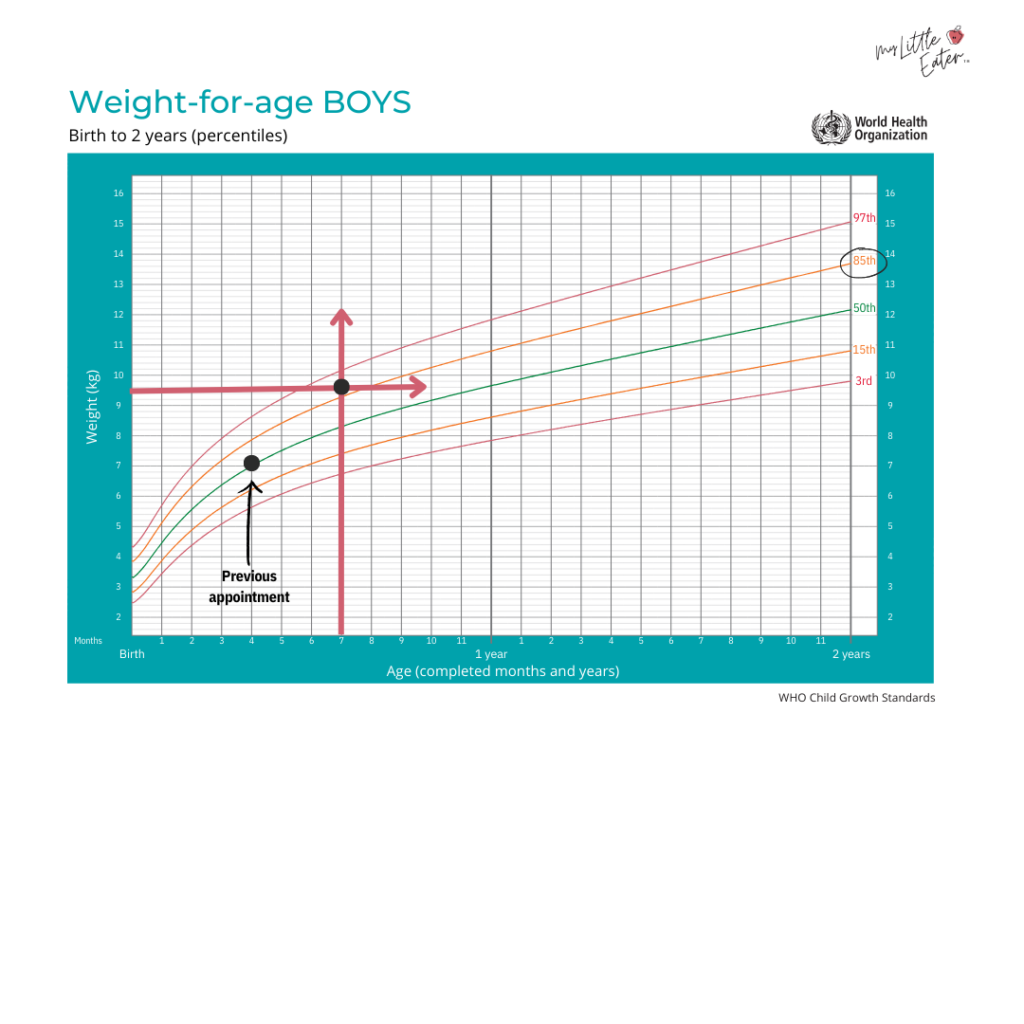
Locate the baby’s weight, length, or head circumference on the vertical axis. Then find the age on the horizontal axis. Follow both points until they meet.
The curve closest to that point gives an estimated percentile. Percentiles are not exact labels. A result may fall between two lines.
4. Compare past measurements
The most useful question is often, “Is the baby following a similar path?” A baby who tracks near the 25th percentile over time may be growing well. A baby who moves from the 75th to the 15th percentile may need a closer look, even though the latest number is still within a broad normal range.
This is one of the most important lessons in newborn growth charts and percentile interpretation: the trend often matters more than the rank.
Which Measurements Matter Most?
Weight
Weight can change quickly. It is affected by feeding, fluid balance, illness, and the timing of the measurement.
Most newborns lose some weight during the first days after birth. Many regain their birth weight within about two weeks, although timing varies. Babies born early, babies with feeding problems, and babies who experience illness may need more frequent checks.
Length
Length shows long-term body growth. Measuring a newborn’s length requires two people and a firm measuring surface. A small change in body position can alter the result.
Because length measurements can be less precise than weight measurements, clinicians usually look for a pattern over several visits.
Head circumference
Head circumference measures the widest part of the baby’s head. It helps health professionals follow brain and skull growth.
The number should be interpreted with the baby’s overall development and physical examination. A single measurement may be inaccurate if the tape is not placed correctly or if the baby moves.
Weight for length
Weight-for-length helps show whether a baby’s weight fits their body length. This can be more informative than weight alone.
For example, two babies may both weigh 10 pounds, but the shorter baby and the longer baby may have different weight-for-length percentiles. Newborn growth charts and percentile interpretation work best when all major measurements are reviewed together.
Normal Newborn Growth Patterns
Newborn growth is not perfectly smooth. It often moves in small steps rather than a straight line.
During the first days, many babies lose weight because of normal fluid changes. Feeding may also take time to become established. After that early period, steady weight gain is usually expected.
Breastfed and formula-fed babies may show different growth patterns. This does not mean one feeding method is better. It means the reference pattern can vary, especially during later infancy. Health professionals consider feeding method when reviewing the chart.
Growth can also vary among siblings. Genetics influence body size, length, and head circumference. A small parent may have a smaller baby, while taller parents may have larger babies.
A steady curve is usually reassuring when the baby also:
• Feeds well
• Wets diapers regularly
• Has alert periods
• Shows expected movement and development
• Has no signs of ongoing illness
Newborn growth charts and percentile interpretation should never replace a physical examination. Charts support clinical judgment; they do not make the diagnosis alone.

Growth Charts for Premature Babies
Premature babies need special care when their growth is reviewed. Their birth date may not tell the full story because they had less time to grow before delivery.
Clinicians may use:
• Gestational age at birth
• Birth weight and length
• Corrected age
• A preterm growth chart
• A standard infant growth chart after an appropriate transition
Corrected age is often used until around age 2, but the exact approach can vary. Your baby’s pediatrician or neonatal team will explain which age should guide each visit.
For example, imagine a baby born at 32 weeks who is now 12 weeks old. The baby may have a corrected age of 0 weeks because the baby arrived about eight weeks early. Comparing this baby only with full-term 12-week-old infants may create a misleading picture.
This is a key part of newborn growth charts and percentile interpretation. Always ask which age and chart the clinician used.

When Should Parents Be Concerned?
A low or high percentile alone does not prove that something is wrong. Concern usually comes from a combination of findings, such as a sharp change in growth, poor feeding, or signs of illness.
Contact your baby’s health professional promptly if your newborn:
• Has trouble feeding or refuses several feeds
• Vomits repeatedly or has green vomit
• Has much fewer wet diapers than expected
• Is difficult to wake or unusually weak
• Breathes with effort or turns blue
• Continues to lose weight after the early newborn period
• Does not regain birth weight within the time advised by the clinician
• Shows a marked drop across growth percentiles
• Has a head circumference that changes rapidly
Seek emergency care for severe breathing trouble, blue or gray skin, extreme sleepiness, or a baby who cannot feed.
Doctors may check feeding technique, milk transfer, formula preparation, reflux, infection, heart or lung conditions, and other health concerns. A growth concern is not a parent’s fault. It is a signal to gather more information and offer support.
Newborn growth charts and percentile interpretation should lead to questions, not panic. One number rarely tells the whole story.

Common Mistakes in Percentile Interpretation
Treating percentiles like school grades
The 90th percentile is not an “A,” and the 10th percentile is not an “F.” Percentiles do not rank health or parenting.
Comparing babies directly
Two healthy babies of the same age can have very different body sizes. Direct comparisons often create fear without adding useful information.
Using the wrong chart
A chart for older children, a chart for a different sex, or a preterm chart used without guidance can change the result.
Weighing too often
Daily home weights may increase anxiety. Small changes in clothing, scale position, and time of day can affect the number. Follow the schedule recommended by your pediatrician.
Focusing only on weight
Weight matters, but length, head circumference, feeding, development, and physical health matter too.
Adjusting feeds without guidance
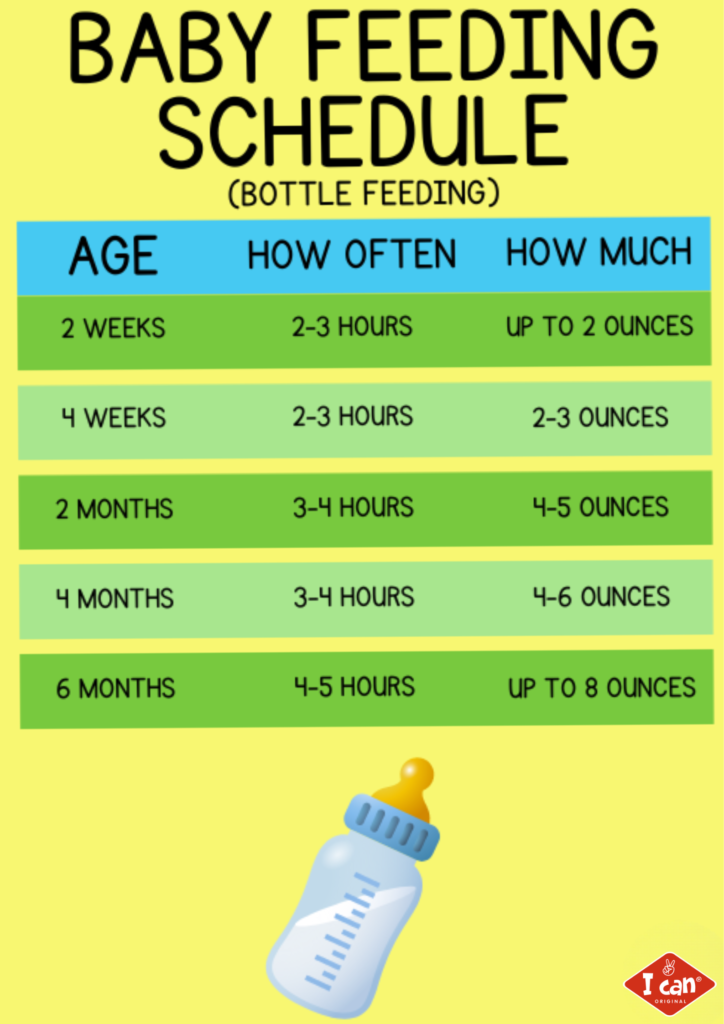
Adding cereal to a bottle, changing formula concentration, or forcing feeds can be unsafe. Discuss feeding concerns with a pediatrician, lactation consultant, or qualified infant feeding specialist.
These mistakes are common because newborn growth charts and percentile interpretation can look more precise than they really are. The chart provides useful evidence, but it still needs context.
How to Prepare for a Growth Check
You can make a growth visit more useful with a little preparation.
- Write down feeding times and amounts, if you track them.
- Note wet and dirty diaper patterns.
- Bring questions about spit-up, crying, sleep, or feeding effort.
- Tell the clinician if the baby was premature or had a difficult birth.
- Ask which chart and age adjustment were used.
- Ask whether the baby is following a healthy pattern.
- Request a clear plan if the clinician wants another weight check.
At home, use the same scale only if your health professional recommends it. Weigh the baby under similar conditions and avoid treating every small fluctuation as a problem.
One practical lesson from reviewing growth data is that measurement quality matters. A baby who squirms during a length check may appear to have grown less than expected. A diaper or blanket can also add weight. Reliable trends come from careful, consistent measurements.
You can ask, “What changed from the last visit?” and “What would make you want to see my baby again sooner?” Clear questions help turn newborn growth charts and percentile interpretation into a shared plan.
Why Growth Trends Matter More Than One Percentile
A percentile is a snapshot. A growth trend is a short video.
Suppose a baby’s weight stays close to the 25th percentile at several visits. That pattern may be reassuring, especially if length, head growth, feeding, and development also look healthy.
Now imagine another baby who begins near the 70th percentile and falls to the 20th percentile over a short period. That change does not prove illness, but it may prompt a feeding review, repeat measurement, or medical assessment.
Percentile changes can happen for harmless reasons. A baby may shift toward a family pattern, recover from an illness, or have an inaccurate earlier measurement. The speed of change and the baby’s overall condition help guide the next step.
Newborn growth charts and percentile interpretation should therefore use several data points whenever possible. Think of the curve as a path, not a finish line.
What Research and Pediatric Guidance Support
Major pediatric and public health guidance agrees on several core points:
• Growth should be monitored over time.
• Weight, length, and head circumference should be interpreted together.
• Premature infants may need corrected age and specialized charts.
• Feeding and health status are essential parts of assessment.
• Growth charts are tools, not stand-alone diagnostic tests.
The WHO standards are based on healthy infant growth under recommended conditions. The CDC provides reference charts for older children and adolescents. The American Academy of Pediatrics advises routine growth monitoring as part of preventive care.
Charts also have limits. Reference groups may not represent every culture, ancestry, feeding pattern, or health condition equally. A percentile should never be used to label a baby without considering family traits, medical history, and clinical findings.
Good newborn growth charts and percentile interpretation combines research with careful observation. It respects the numbers without allowing the numbers to overshadow the baby.
Frequently Asked Questions About Newborn Growth Charts and Percentile Interpretation
What is a normal newborn percentile?
There is no single ideal percentile. A healthy newborn may be at a low, middle, or high percentile if growth is steady and the baby is feeding and developing well.
Is the 10th percentile too low for a newborn?
Not always. Some healthy babies naturally track near the 10th percentile, especially when their family members are smaller, but a clinician should review the full growth pattern and health history.
Is the 90th percentile too high?
A 90th percentile measurement can be normal. Health professionals also review length, weight-for-length, family size, feeding, and changes over time before deciding whether follow-up is needed.
How often should a newborn’s growth be checked?
Newborns often have weight checks during the first days or weeks, followed by routine well-child visits. The schedule may be more frequent if the baby was premature, lost significant weight, or has feeding concerns.
Should I use corrected age for my premature baby?
Often, yes. Corrected age helps compare a premature baby with babies at a similar developmental stage, but the exact chart and timing should be confirmed with the baby’s pediatrician.
Can a growth chart diagnose a health problem?
No. A growth chart can reveal a pattern that needs more review, but it cannot diagnose a condition by itself. A medical professional must combine the chart with an examination, history, and feeding assessment.
Conclusion
Newborn growth charts and percentile interpretation help families and clinicians follow a baby’s growth over time. Percentiles are comparisons, not grades, and a steady pattern often matters more than a single number.
Use the correct chart, consider corrected age for premature babies, and review weight, length, head circumference, feeding, and development together. If a baby has poor feeding, fewer wet diapers, unusual sleepiness, breathing trouble, or a sharp growth change, contact a health professional promptly.
Bring your questions to each visit and ask what the trend means for your baby. For more reliable guidance, review the chart with your pediatrician and explore trusted child health resources.